Population Census 2022: A CHT demographic analysis
SAYED IBN RAHMAT
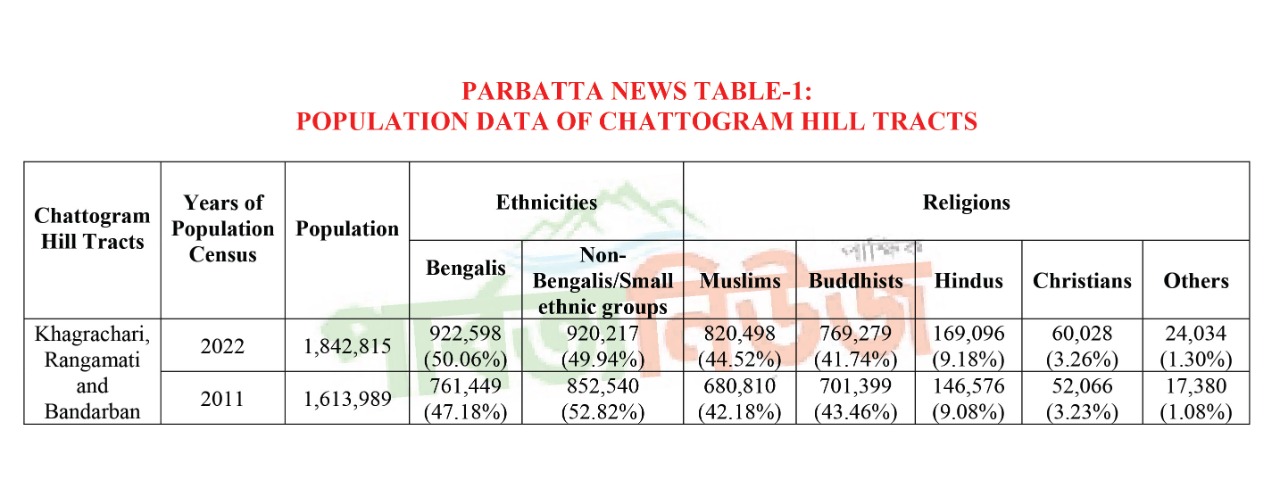
A comparative analysis of the preliminary report of the Population and Household Census 2022 recently released by the Bangladesh Bureau of Statistics (BBS) and the census report of 2011 shows that the Bengali population has increased while the non-Bengali/small ethnic population has decreased in Chattogram Hill Tracts. According to the preliminary report of the 2022 census, the combined population of the three hill districts, namely Khagrachari, Rangamati, and Bandarban, is 1,842,815. Of them, 922,598 (50.06%) are Bengalis, and 920,217 (49.94%) are non-Bengali/small ethnic people. The 2011 census report showed the total population of the three hill districts at 1,613,989. Of them, 761,449 (47.18%) are Bengalis, and 852,540 (52.82%) are non-Bengali/small ethnic people. That is, compared to the census of 2011, the percentage of Bengali people has increased by 2.88% while that of the non-Bengali/small ethnic people in Chattogram Hill Tracts has decreased by 2.88%.
According to the preliminary report of the 2022 population census, Muslims in the three hill districts make up 820,498 (44.52% of the total population there), Buddhists 769,279 (41.74%), Hindus 169,096 (9.18%), Christians 60,028 (3.26%) and others 24,034 (1.30%). According to the 2011 population census, there were 680,810 Muslims (42.18%), 701,399 Buddhists (43.46%), 146,576 Hindus (9.08%), 52,066 Christians (3.23%), and 17,380 others (17.08%). In other words, the number of Buddhists has decreased in the Chattogram Hill Tracts while the number of Muslims, Hindus, and Christians has increased. Even those who do not practice any of the four mentioned religions (nature worshippers) have increased in number. According to the latest available data, the number of Buddhists in the Chattogram Hill Tracts has increased by 67,880 since 2011, but the overall percentage has decreased by 1.72%. On the other hand, the Muslim population has increased by 139,688 people, or 2.34%. The Hindu population has increased by 22,520 people, or 0.1%. The number of Christians has increased by 7,962 and by 0.03% in percentage terms. Other (nature worshippers) religions’ adherents have increased by 6,654 or by 0.22%.
The three hill districts cover approximately 13,191 square kilometers, accounting for 11.19% of the country’s total area of 147,570 square kilometers. The total population of the three hill districts, on the other hand, is 1,842,815, or 1.16% of the country’s total population of 165,158,616. That is, the Chattogram Hill Tracts, or CHT, which covers 11.19% of the country, is home to 1.16% of the total population.
KHAGRACHHARI POPULATION
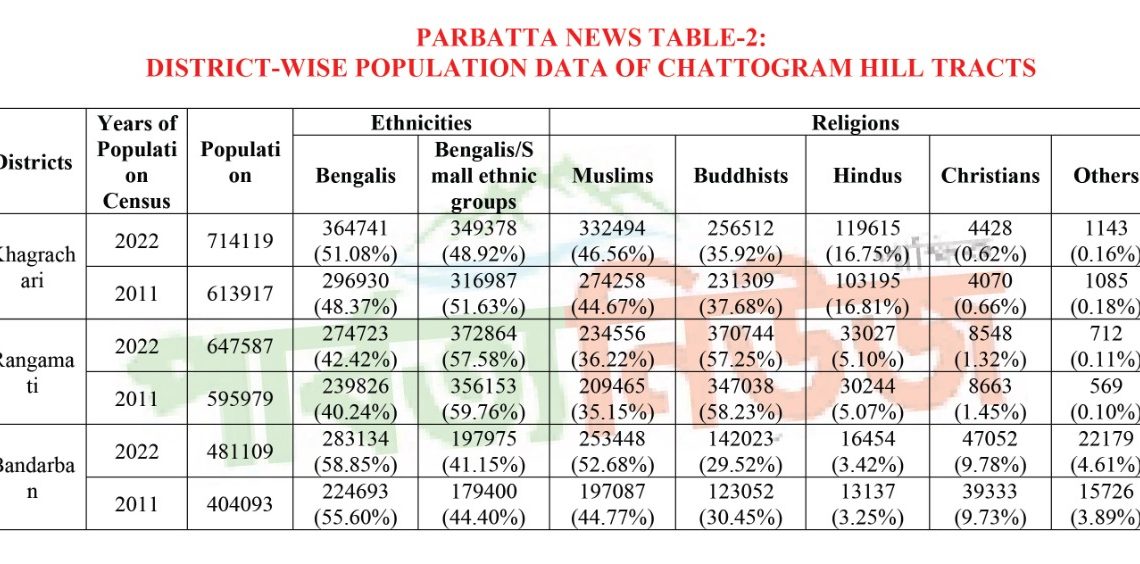
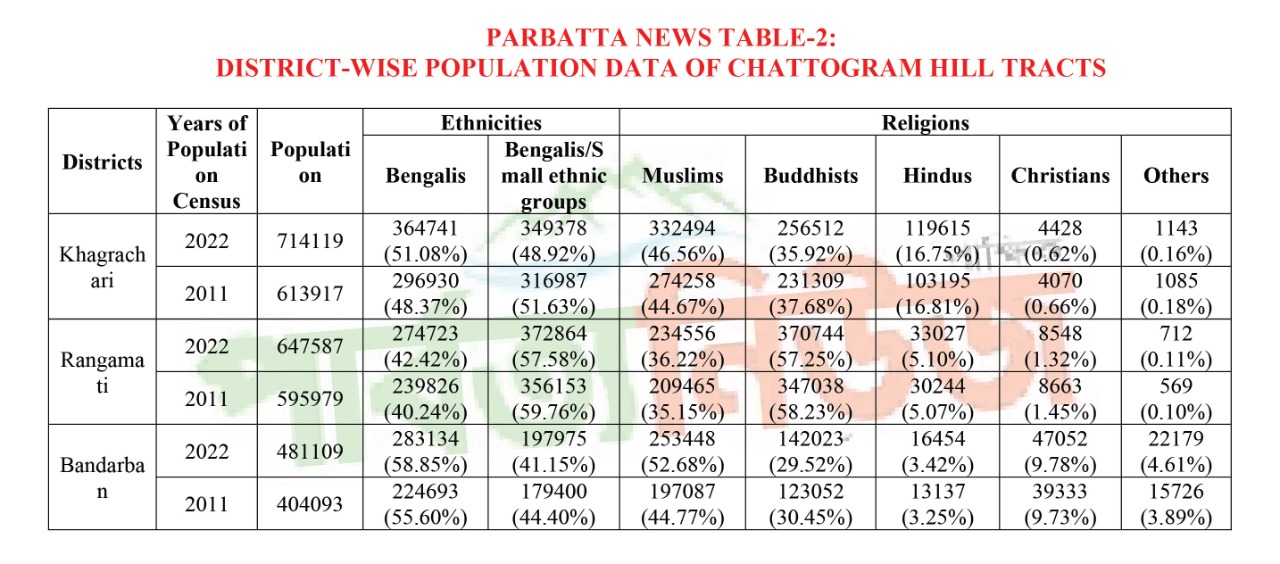
According to the preliminary report of the population census 2022, Khagrachhari has a total of 714,119 people. There are 364,741 Bengalis (51.08%) and 349378 non-Bengalis/small ethnic people (48.92%) among them. Of them, Muslims make up 332,494 (46.56%), Buddhists 256,512 (35.92%), Hindus 119,615 (16.75%), Christians 4,428 (0.62%), and others 1,143 (0.16%). The population density in Khagrachari district is 260 per square kilometer, and the literacy rate is 71.73%. According to the 2011 census report, Khagrachari had a total of 613,917 people. Of them, there were 296,930 Bengalis (48.37%) and 316987 (51.63%) non-Bengali/small ethnic people. Of them, Muslims made up 274,258 (44.67%), Buddhists 231,309 (37.68%), Hindus 103,195 (16.81%), Christians 4,070 (0.66%), and others 1,085 (0.18%). In 2011, the population density in Khagrachhari district was 223 per square kilometer, and the literacy rate was 46.1%.
RANGAMATI POPULATION
Rangamati district has a total population of 647,587 people, according to the preliminary report of the census 2022. There are 274,723 Bengalis (42.42%), and 372864 non-Bengali/small ethnic people (57.58%). Of them, Muslims make up 234,556 (36.22%), Buddhists 370,744 (57.25%), Hindus 33,027 (5.10%), Christians 8,548 (1.32%), and others 712 (0.11%). The population density in Rangamati district is 106 per square kilometer, and the literacy rate is 71.33%. Rangamati had a total of 595,979 people, according to the 2011 census. There were 239,826 Bengalis (40.24%) and 356,153 non-Bengalis/small ethnic people (59.76%) among them. Muslims made up 209,465 (35.15%), Buddhists 347,038 (58.23%), Hindus 302,44 (5.07%), Christians 8,663 (1.45%), and others 569 (0.10%). Rangamati district had a population density of 97 per square kilometer in 2011 and a literacy rate of 49.7%.
BANDARBAN POPULATION
According to the preliminary population census 2022 report, the total population of the Bandarban district is 481,109 people. There are 283,134 Bengalis (58.85%) and 197,975 non-Bengalis/small ethnic people (41.15%). Of them, Muslims make up 253,448 (52.68%), Buddhists 142,023 (29.52%), Hindus 16,454 (3.42%), Christians 47,052 (9.78%), and others 22,179 (4.61%). The district of Bandarban has a population density of 107 per square kilometer and a literacy rate of 63.64%. Bandarban had a population of 404,093, according to the 2011 census. There were 224,693 Bengalis (55.60%) and 179,400 non-Bengalis/small ethnic people (44.40%) among them. Of them, Muslims made up 197,087 (44.77%), Buddhists 123,052 (30.45%), Hindus 13,137 (3.25%), Christians 39,333 (9.73%), and others 15,726 (3.89%). Bandarban district had a population density of 87 per square kilometer in 2011 and a literacy rate of 31.7%.
A COMPARISON OF THE POPULATION OF CHATTOGRAM HILL TRACTS WITH THE REST OF THE COUNTRY
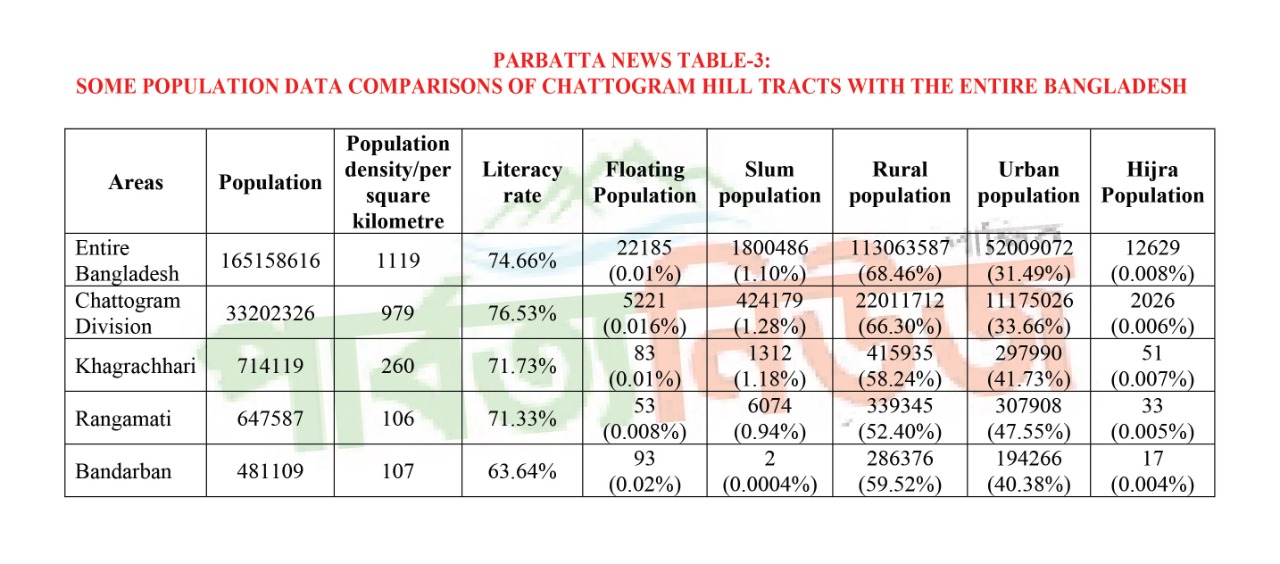
An analysis of some data from the preliminary report of the census 2022 – comparing the population of Chattogram Hill Tracts to the entire country – has yielded some extraordinary results. In comparison to the rest of the country, the population density in the Chattogram Hill Tracts is very low. In comparison to the country’s average of 1,119 people per square kilometer, 979 live in Chattogram division, 260 in Khagrachari, 106 in Rangamati, and 107 in Bandarban. The literacy rate in the Chattogram Hill Tracts (Khagrachari 71.73%, Rangamati 71.33%, and Bandarban 63.64%) is nearly equal to the national literacy rate (74.66%), and is higher than the literacy rate in the Mymensingh division (67.09%). The rate of homeless floating population in the Chattogram Hill Tracts (0.01% in Khagrachari, 0.008% in Rangamati, and 0.02% in Bandarban) is lower than the national rate (0.01%). Rangamati (0.94%) and Bandarban (0.0004%) have fewer slum dwellers than the rest of the country (1.10%), but Khagrachari (1.18%) has more and it is most likely due to the large Bengali population living in the slums of Khagrachari’s cluster villages. Although cluster villages exist in Rangamati, they are few in number, and Bandarban has no slum dwellers due to the lack of cluster villages. In the Chattogram Hill Tracts, fewer people live in rural areas than in the rest of the country (58.24% in Khagrachari, 52.40% in Rangamati, and 59.52% in Bandarban). People from the Chattogram Hill Tracts, on the other hand, live in urban areas at a higher rate than the national average (31.49%). This could imply that the people of the Chattogram Hill Tracts are becoming more interested in modern urban life rather than earning a living by cultivating jhum (shifting cultivation) in the hilly areas. The three hill districts, on the other hand, have 101 hijras (people of the third gender).
KEEP READING
জনশুমারি ২০২২: পার্বত্য চট্টগ্রামের জনমিতি বিশ্লেষণ
Bhusanchara Genocide: 400 Bengalis Killed Within Hour
The Migration Of Small Ethnic Groups To Bangladesh And Their Original Habitats
Role Of Tribal Leaders Of CHT In The Liberation War Of Bangladesh
পার্বত্য চট্টগ্রামে সংসদীয় আসন সংখ্যা ন্যায়সঙ্গত করা হোক
NON-BENGALI/MINORITY POPULATION OF BANGLADESH
According to the preliminary report of the 2022 census, there are 50 non-Bengali/minor ethnic groups living in Bangladesh. Besides them, there are some groups in the country. They were not named in the latest census report. Bangladesh has a total non-Bengali/small ethnic population of 1,650,159, accounting for 0.10% of the country’s total population. The population of the 50 communities is 1,581,621 (95.85% of the total non-Bengali/minor ethnic population) and the population of other communities is 685, 38 (4.15% of the total non-Bengali/small ethnic population).
NAMES AND POPULATION OF NON-BENGALI/SMALL MINORITIES (IN ALPHABETIC ORDER)
Badeiya 7,207 (0.44%), Bagdi 12,092 (0.73%), Bam 13,193 (0.80%), Banai 2,851 (0 .17%), Baraik/Garchaik 3,444 (0.21%), Barman 44,657 (2.71%), Bhumimali 1930 (0.12%), Bhumji 9,664 (0.59%), Chak 3,077 (0.19%), Chakma 483,299 (29.29%), Dalu 386 (0.02%), Ganju 4,137 (0.25%), Garait 2,727 (0.17%), Garo 76,846 (4.66%), Hajong 7 ,996 (0.48%), Ho 223 (0.01%), Hudi 1,503 (0.09%), Kadha 816 (0.05%), Kanda 1,898 (0.12%), Lohar 3,418 (0.21%), Lusai 380 (0.02%), Mahali 6,614 (0.40%), Mahato/Rkummiahato/Badeyamahato 19,271 (1.17%), Malo/Ghasmialo 14,771 (0.90%), Manpuri 22,978 (1.39%), Marma 224,261 (13.59%), Munda 60,191 (3.65%), Mushar 4,600 (0.28%), Oraon 85,846 (5.20%), Pahari/Malpahari 8,801 (0.53%), Pankhwa/Pangkho 1,857 (0.11%), Patra 3,100 (0.19%), Rakhine 11,195 (0.68%), Razwar 2,327 (0.14%), Rgukha 100 (0. 01%), Ro 52,455 (3.18%), Santal 129,049 (7.82%), Shabar 1,980 (0.12%), Tali 2,082 (0.13%), Tanchanga 45,972 (2.79%), Tripura 156,578 (9.49%), Turi 3,792 (0.23%), Voli 95 (0.01%), Others 68,538 (4.15%).
NAMES AND POPULATION OF NON-BENGALI/SMALL MINORITIES (IN DESCENDING ORDER)
Chakma 483,299 (29.29%), Marma 224,261 (13.59%), Tripura 156,578 (9.49%), Santal 129,049 (7.82%), Oraon 85,846 (5 .20%), Garo 76,846 (4.66%), Munda 60,191 (3.65%), Ro/Murang 52,455 (3.18%), Tanchanga 45,972 (2.79%) ), Burman 44,657 (2.71%), Manipuri 22,978 (1.39%), Mahato/Kurmimahato/Bediamahato 19,271 (1.17%), Malo/Ghasimalo 14,771 (0.90% ), Koch 13,702 (0.83%), Bom 13,193 (0.80%), Khasia/Khasi 12,421 (0.75%), Bagdi 12,092 (0.73%),
Rakhine 11,195 (0.68%), Bhumij 9,664 (0.59%), Hill/Hill 8,801 (0.53%), Hajong 7,996 (0.48%), Bedia 7,207 (0.44%), Mahali 6,614 (0.40%), Khiang 4,826 (0.29%), Mushar 4,600 (0.28%), Ganju 4,137 (0.25%) , coal 3,822 (0.23%), Turi 3,792 (0.23%), Khumi 3,780 (0.23%), Baraik/Baraik 3,444 (0.21%), Lohar 3, 418 (0.21%),Patra 3,100 (0.19%), Kharia/Khariya 3,099 (0.19%), Chak 3,077 (0.19%), Banai 2,851 (0.17%), Garait 2,727 (0.17%), Rajwar 2,327 (0.14%), Teli 2,082 (0.13%), Shabar 1,980 (0.12%), Bhuimali 1930 (0.12%), Kanda 1,898 (0.12%), Pangkhwa/Pangkho 1,857 (0.11%), Hudi 1,503 (0.09%), Kadha 816 (0.05%), Dalu 386 (0.02%) ), Lusai 380 (0.02%), Kharwar/Kherwar 312 (0.02%), Ho 223 (0.01%), Gurkha 100 (0.01%), Bhil 95 (0.01%), Others 68,538 (4.15%).
TRIBES/MINOR ETHNIC GROUPS NAMED IN THE CHATTOGRAM HILL TRACTS ACCORD
Observing the names of the tribes/minor ethnic groups named in the Chattogram Hill Tracts Agreement signed on 2 December 1997, their population and their percentage of the total population of the ethnic minorities living in the country, it has been found that Chakma accounts for 483,299 (29.29%), Marma 224,261 (13.59%), Tripura 156,578 (9.49%), Murang/Mro 52,455 (3.18%), Tanchanga 45,972 (2.79%), Bom 13, 193 (0.80%), Khiang 4,826 (0.29%), Khumi 3,780 (0.23%), Chak 3,077 (0.19%), Pankhwa/Pangkho 1,857 (0. 11%), Lusai 380 (0.02%).
SIXTH POPULATION AND HOUSEHOLD CENSUS-2022
The preliminary report of the 2022 census was released on July 27, 2022, at a press conference hosted by the Bangladesh Bureau of Statistics (BBS) at the Bangabandhu International Conference Center in the capital Dhaka. Prior to this, the sixth census was completed across the country from June 15 to June 21, 2022. This census was conducted digitally for the first time. Bangladesh has a total of 16 crore 51 lakh 58 thousand 616 people, according to the preliminary report of this census. There are 8 crore 17 lakh 12 thousand 824 men, 8 crore 33 lakh 47 thousand 206 women, and 12 thousand 629 transgender people among them. That is, for every 98 men, there are 100 women in the country.
The country’s population has grown by 2 crore 11 lakh 14 thousand 919 people in the last ten years. Dhaka division is home to 4 crore 4 million people, or 4% of the total population. Aside from that, 3 crore 32 lakh people live in Chattogram, 2 crore 3 lakh people live in Rajshahi, and 9.1 lakh people live in Barisal division.
The country’s annual population growth is 1.22%, down from 1.46% a decade ago. The population density in the country is now 1,119 people per square kilometer, up from 976 people a decade ago. Muslims make up 91.04 % of the total population, while Hindus make up 7.95%. The country’s literacy rate is 74.66%. Furthermore, the disability rate is 1.43%.
EXPERT OPINION
Asked why the Bengali population has increased and the non-Bengali/minority population decreased in Chattogram Hill Tracts, Banchita Chakma, former principal of Rangamati Government College and former member of the National Human Rights Commission, said, “This year’s survey is flawed. I checked with several people I know in Rangamati, and no enumerator went to their house. Furthermore, this census has carried out during the rainy season. On rainy days, the roads and communication system in Chattogram Hill Tracts are extremely difficult. As a result, the enumerators were unable to properly reach the remote areas. In remote areas, people of small ethnic groups are usually in large numbers. As a result of these factors, their representation in this survey is lower. Therefore, I believe that this survey has not accurately reflected the real picture of the population of the Chattogram Hill Tracts.”
When asked the same question, Mehadi Hassan Palash, Chairman of the CHT Research Foundation and Editor of Parbatta News, said, “There are several reasons for the increase in the number of Bengalis and the decrease in the population of small ethnic groups in the Chattogram Hill Tracts. To begin with, the Bengalis of Chattogram Hill Tracts are significantly behind in terms of education, employment, economy, and health awareness, so there is a lack of awareness and interest in birth control. Ethnic minorities, on the other hand, are more interested in birth control because they are more advanced in terms of education, employment, economy, and health awareness. Mothers who are educated and health-conscious are generally not interested in having more children, whereas mothers from less educated or uneducated minority groups are often engaged in hard work such as jum farming to support the family, making it difficult for them to have more children.
“Second, because of the various incentives and opportunities provided by various developed countries and donor organizations in terms of education and employment for minority groups and tribes, a significant number of people from minority groups travel to different countries every year. Many of them chose to remain in those countries rather than return to Chattogram Hill Tracts.
“Third, because of government quotas in higher education and employment, a large number of youth from minority groups leave Chattogram Hill Tracts every year. After becoming accustomed to modern urban life, many of them are settling in various districts of the plain rather than returning to the hill tracts. Many people are not returning to the Chattogram Hill Tracts because of also the ongoing violence and daily murders, kidnappings, and extortions among tribal regional groups.
“Fourth, it is known from various media sources that a large portion of the new generation has been involved in separatist terrorist activities in the Chattogram Hill Tracts in recent years. Furthermore, many people from small ethnic groups involved in such terrorist activities in the east have sent their families to different countries, including neighboring ones, to keep them safe. A significant portion of the money earned through extortion, kidnapping, drug trafficking, and terrorism is smuggled to family members in other countries. It is mainly because of these factors that the census report shows a decrease of the population of small ethnic groups in the Chattogram Hill Tracts.”
KEEP READING
জনশুমারি ২০২২: পার্বত্য চট্টগ্রামের জনমিতি বিশ্লেষণ
পার্বত্য চট্টগ্রামে সংসদীয় আসন সংখ্যা ন্যায়সঙ্গত করা হোক
Bhusanchara Genocide: 400 Bengalis Killed Within Hour
The Migration Of Small Ethnic Groups To Bangladesh And Their Original Habitats
Role Of Tribal Leaders Of CHT In The Liberation War Of Bangladesh